

Search Website
Curriculum Mapping
Once programs have established Program-level Learning Outcomes (PLOs), they should prepare a curriculum map to demonstrate the level of competence achieved for each outcome in each course and show the progression of learning. Once complete, curriculum maps can provide a visual representation of the relationship between PLOs and courses across the program. Curriculum maps also provide a way of showing the distribution of different teaching methodologies and assessments across courses.
Curriculum mapping can be completed at any time, but it is required for programs undergoing self-studies as part of the institutional quality assurance process (IQAP). The Centre for Teaching and Learning supports undergraduate mapping, and the School of Graduate and Postdoctoral Studies supports graduate mapping.
For detailed instructions on how to complete undergraduate curriculum mapping, please refer to Steps for Undergraduate Curriculum Mapping.
Rationale
The curriculum mapping process is an opportunity for a program to review curricular alignment, examine the progression of learning for students enrolled in a program, and ensure that all learning outcomes are addressed as expected within the program. This process also provides an opportunity for individual faculty members to see how their courses fit into the larger program. Faculty members engage in curriculum mapping to review, over the course of a program, what gets taught, when it gets taught, and how it gets assessed. Faculty members' experiences in their individual classrooms are a key component of analysis in the curriculum mapping process.
Informed, in part, by departmental questions about student learning, data can be collected to help answer questions about:
- How students progress through a program
- The level of complexity/depth at which program learning outcomes are addressed in each course
- Any gaps, redundancies, or inconsistencies in how learning outcomes are taught and assessed
- The distribution of instructional and assessment methods across the program
- How students in the program meet the relevant degree-level expectations (WDOs and Ontario Graduate Degree Level Expectations).
Results of mapping data are meant to be triangulated with other data to help inform faculty-driven decisions about the curriculum.
Approaches to the Curriculum Map
Curriculum maps can be organized in various ways depending on the goals of analysis. Possible ways of organizing course data include:
A progression of learning map demonstrates the degree to which learning outcomes are addressed and assessed in each course:
- Introduction (I): students are introduced to essential knowledge, skills, and values,
- Reinforcement (R): students have opportunities to practice and apply these in course activities and assessments
- Proficiency (P): students must demonstrate the ability to apply the knowledge, skill, or values capably and independently.
Once all courses are mapped, a progression of learning map can show how students progress through each learning outcome as they move through the program. This is one of the approaches that the CTL takes in our mapping process.
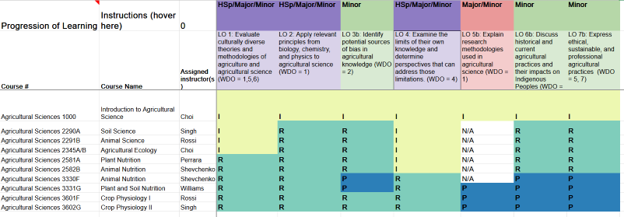
Screenshot of an example Progression of Learning Map for the Minor in Agricultural Science
Progression of Learning Maps can be most informative when mapping is completed at the module level. Modules within the same department are often similar but will have some marked differences. These differences should be clear in the PLOs for that module. For example, an Honours Specialization or Major will often have more PLOs than a Minor; an Honours Specialization will often require higher order outcomes, demonstrating more proficiency in key knowledge, skills, and values for the program.
|
Honours Specialization |
Major |
Minor |
|
PLO1: Evaluate culturally diverse theories and methodologies of agriculture and agricultural science
PLO2: Apply relevant principles from biology, chemistry, and physics to agricultural science
PLO3a: Critique the sources of their agricultural knowledge from various perspectives and identify bias
PLO4: Examine the limits of their own knowledge and determine perspectives that can address those limitations
PLO5a: Design research studies to address questions in agricultural science
PLO6a: Judge the impact of historical and current agricultural practices on Indigenous peoples and on various ecological systems
PLO7a: Adopt ethical, sustainable, and professional agricultural practices
PLO8: Contribute to Indigenous-led agricultural projects or initiatives |
PLO1: Evaluate culturally diverse theories and methodologies of agriculture and agricultural science
PLO2: Apply relevant principles from biology, chemistry, and physics to agricultural science
PLO3a: Critique the sources of their agricultural knowledge from various perspectives and identify bias
PLO4: Examine the limits of their own knowledge and determine perspectives that can address those limitations
PLO5b: Explain research methodologies used in agricultural science
PLO6a: Judge the impact of historical and current agricultural practices on Indigenous peoples and on various ecological systems
PLO7a: Adopt ethical, sustainable, and professional agricultural practices
PLO8: Contribute to Indigenous-led agricultural projects or initiatives |
PLO1: Evaluate culturally diverse theories and methodologies of agriculture and agricultural science
PLO2: Apply relevant principles from biology, chemistry, and physics to agricultural science
PLO3b: Identify potential sources of bias in agricultural knowledge
PLO4: Examine the limits of their own knowledge and determine perspectives that can address those limitations
PLO5b: Explain research methodologies used in agricultural science
PLO6b: Discuss historical and current agricultural practices and their impacts on Indigenous Peoples
PLO7b: Express ethical, sustainable, and professional agricultural practices |
For more information on how to create and refine program learning outcomes, see our resource on Program Learning Outcomes.
A taught and assessed map focuses more on how learners engage with each learning outcome, rather than the degree to which the outcome is achieved. It shows in which courses an outcome is taught and in which courses an outcome is assessed. The four possible states are:
- Not Taught and Not Assessed
- Taught and Not Assessed
- Not Taught and Assessed
- Taught and Assessed
This approach can be useful to ensure that there is adequate instructional and assessment coverage for all learning outcomes and identify if any learning outcomes are assessed without being taught or taught without being assessed.
Instructional/ Assessments Methods
Curriculum mapping can also be a valuable tool for identifying the learning and assessment strategies used across the program. This data can ensure that programs utilize an appropriate mix of assessment types and can inform conversations about alignment between skills and values of the program and how students are supported and assessed. These can be organized in different ways, depending on the concern or focus of the mapping process:
One of the charts generated through the CTL curriculum mapping process is a snapshot of how many courses utilize each assessment or instructional method. This can be useful when considering the overall instructional and assessment make-up of the program.
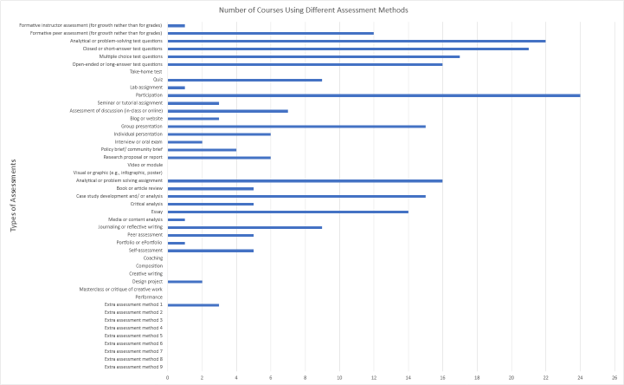
Screenshot of the Assessment Summary chart for the Agricultural Science program.
Another chart generated in the CTL curriculum mapping process is an overview of the Instructional and Assessment methods by year. This chart is typically used to inform conversations about how learning is scaffolded throughout a program.
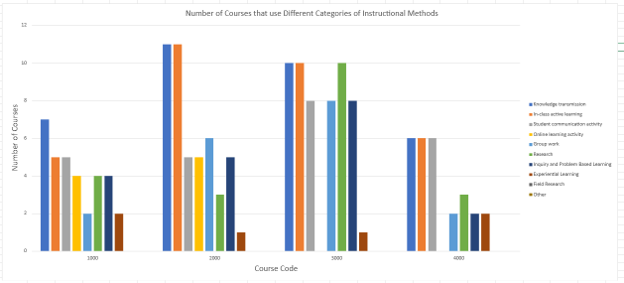
Screenshot of the Instructional Methods by Year chart for the Agricultural Science program.
Programs may also be interested in understanding the instructional or assessment methods used to teach each outcome. This is not an approach taken in the CTL curriculum mapping process, but this can be used by departments who are interested in determining the degree of alignment between the way that learning is supported or students are evaluated on each outcome.
Alignment With Degree-Level Expectations
Curriculum maps can also be a helpful tool for ensuring that programs align with degree-level expectations, either those set by Western or the province.
This could be integrated into an existing curriculum map, as in the example of the Minor in Agricultural Science program shown below, which indicates which learning outcomes map onto each WDO in the second row.

Screenshot of the header rows of an example Progression of Learning Map for the Minor in Agricultural Science showing the WDO alignment with each learning outcome.
Programs may also opt for a separate, more detailed, mapping process for showing the relationship between program level outcomes and degree-level expectations. At Western, the Template for Review of an Existing Graduate Program provides one way of approaching this through a detailed mapping table. This table consists of four columns, with the first two columns depicting the alignment between program level learning outcomes for each module and the Ontario Graduate Degree Level Expectations. The last two columns provide a narrative of how the program supports the achievement of the program learning outcomes and how the outcomes are evaluated.
Example Self-Study Table for Masters of Digital Media
Programs could also approach this through a requirements tracking document, which summarizes the role of each course (required and elective) or other program requirements (such as a graduate milestones or the thesis) in achieving the program learning outcomes and graduate degree level expectations. The example below demonstrates this approach for the Masters of Digital Media.
Ways that the CTL supports
As you begin the curriculum mapping process, CTL is here to help! We support undergraduate programs departments in the curriculum mapping process in the following ways:
- Offering consultations prior to curriculum mapping session
- Providing examples and templates of curriculum maps
- Providing support in interpreting curriculum maps
If you would like to discuss this topic further, please contact a member of the CTL curriculum team.
Now What?
Once data collection, Program-level Learning Outcomes, and Curriculum Maps are complete you can proceed with completing other components of the IQAP Self Study. Please see the Office of Academic Quality Assurance website for the detailed self-study template.